Improve Writing Task 1 Pie Chart The average percentage in typical meals
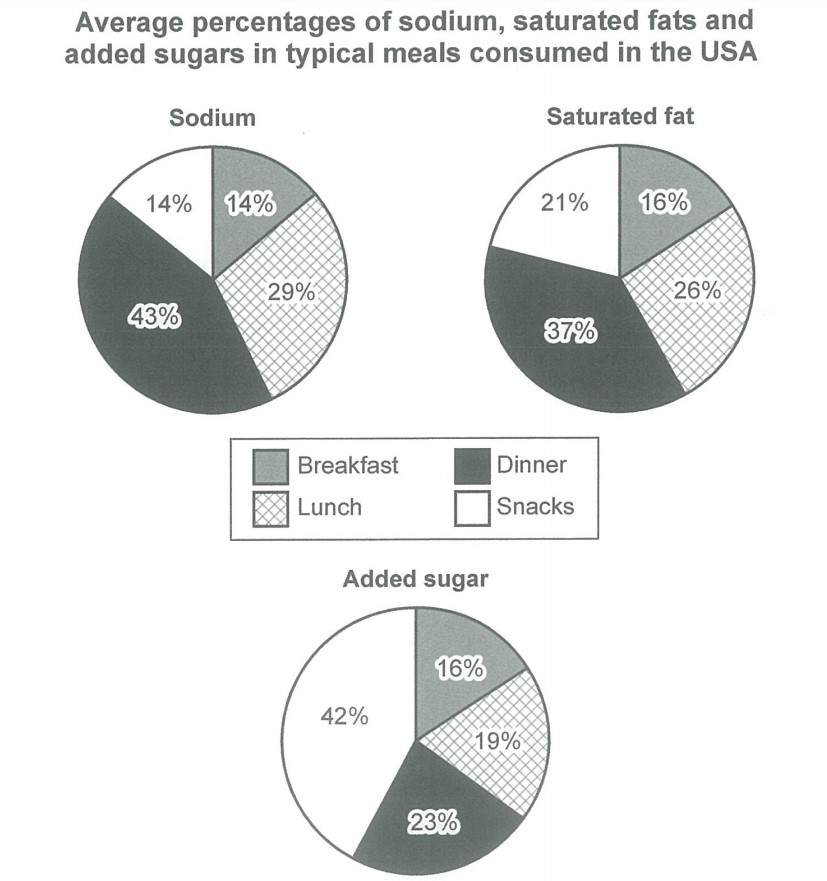
The charts below show the average percentages in typical meals of three types of nutrients, all of which may be … Read more
The charts below show the average percentages in typical meals of three types of nutrients, all of which may be … Read more