The table below shows the percentage of the population by age groups in one town who rode bicycles in 2012
Summarise the information by selecting and reporting the main features, and make comparisons where relevant. You should write at least 150 words.
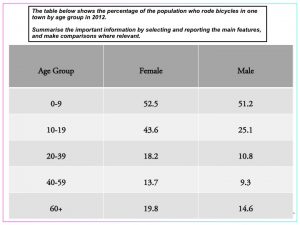
The table illustrates the proportions of people across different age categories who rode bicycles in one particular town in 2012. Overall, the table clearly shows that a higher proportion of females cycled in the given period compared to males across all ages, although only marginally for the youngest group. This group (0-9 yrs.) also had the largest proportion of cyclists, and age was a clear predictor for decreased cycling activity for both males and females, with the exception of the oldest age group (60+), which bucked this trend.
Turning to the figures, just over half of all young girls and boys aged 0-9 years rode bikes in the town, with 52.5% and 51.2% respectively, amounting to the smallest gender gap of any age group. In contrast, 43.6% of 10-19 year old girls chose to ride bikes, while only 25.1% of boys did the same. This pattern continued with the 20-39 age group, with 18.2% of young women cycling compared to 10.8% of young men. The gender differences were less significant in middle aged cyclists (40-59), with 13.7% (female) and 9.3% (male). Finally, the over 60s reversed this trend with more cyclists than the previous two age groups, with 19.8% and 14.6% respectively for females and males.
Analysis
Firstly, it’s important to note that this answer has clear paragraphing. The first paragraph contains an introductory sentence and an overview. The second paragraph presents the detailed figures.
Although in IELTS Writing Task 1, paragraphing isn’t mentioned in the band descriptors below band 8, it is still a good idea to use paragraphs to organize your writing as it makes it more logical, which helps the examiner to read your answer, and that is always a good thing!
Paragraph 1: Introduction and Overview
The table illustrates the proportions of people across different age categories who rode bicycles in one particular town in 2012. Overall, the table clearly shows that a higher proportion of females cycled in the given period compared to males across all ages, although only marginally for the youngest group. This group (0-9 yrs.) also had the largest proportion of cyclists, and age was a clear predictor for decreased cycling activity for both males and females, with the exception of the oldest age group (60+), which bucked this trend.
-
The first sentence introduces the chart, by paraphrasing (not copying) the question.
-
The second sentence begins the overview of the table by describing the most important overall trend (more female than male cyclists for every age).
-
The third sentence completes the overview by describing another important trend (younger people cycle more, except for the over 60s).
Paragraph 2: Detailed Figures
Turning to the figures, just over half of all young girls and boys aged 0-9 years rode bikes in the town, with 52.5% and 51.2% respectively, amounting to the smallest gender gap of any age group. In contrast, 43.6% of 10-19 year old girls chose to ride bikes, while only 25.1% of boys did the same. This pattern continued with the 20-39 age group, with 18.2% of young women cycling compared to 10.8% of young men. The gender differences were less significant in middle-aged cyclists (40-59), with 13.7% (female) and 9.3% (male). Finally, the over 60s reversed this trend with more cyclists than the previous two age groups, with 19.8% and 14.6% respectively for females and males.
-
The first sentence begins the description of the detail by talking about the youngest age group (girls cycled slightly more than boys), commenting on the smallest gender difference.
-
The second sentence gives details of the 10-19 age group, comparing figures for older boys and girls, and noting the contrasting large gender difference.
-
The third sentence presents the figures for the next age group (20-39), again with figures for each gender, noting the trend in gender difference is the same as the previous group.
-
The fourth sentence continues with the next group, again with figures for women and men, noting a smaller difference.
-
The fifth and final sentence gives the figures for the over 60s, noting that these figures are higher than the previous two groups. No conclusion is required for Task 1 writing.


0 Comments