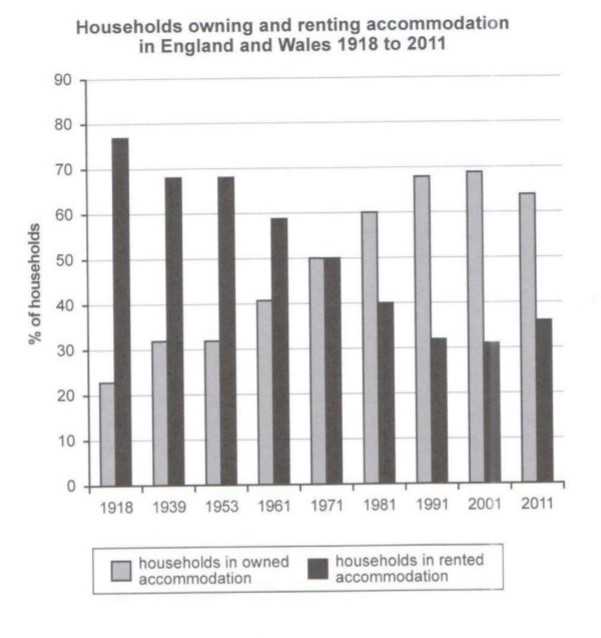
The chart below shows the percentage of households in owned and rented accomodation in England and Wales between 1918 and 2011.
Summarise the information by selecting and reporting the main features, and make comparisons where relevant.
IELTS Cambrdige 13 Writing Task 1: Households England and Wales
The presented diagram illustrates percentages of owned and rented English and Welsh accomodation from 1918 to 2011. Overall, owning and renting showed opposite trends with a sharp increase in ownership and a reciprocal decline in the percentage of renters. By the end of the period, overall ownership had overtaken renting by a wide margin.
In 1918, household ownership stood at around 23% compared to rentals, which were at nearly 80%. From that point there was a steady rise in ownership and decline in rentals. Rentals reached 69% in 1939 and held steady until 1953 before falling to 59% in 1961. Ownership rose to 31% in 1939, remained there in 1953 before becoming even with rentals at 50% each in 1971.
This trend continued for both percentages with rentals declining sharply to 40% and 31% in 1981 and 1991, respectively. Likewise, ownership rose to 60% and 69% in the same years. In 2001, the falling rate of rentals slackened to 31% (69% for ownership) and there was a small rebound that bucked the trend at the end of period with rented houses rising to nearly 40% and owned houses dipping to just over 60%.
Analysis
1. The presented diagram illustrates percentages of owned and rented English and Welsh accomodation from 1918 to 2011. 2. Overall, owning and renting showed opposite trends with a sharp increase in ownership and a reciprocal decline in the percentage of renters. 3. By the end of the period, overall ownership had overtaken renting by a wide margin.
1. The first sentence simply paraphrases (changes some of the words) from the task question. Don’t waste time on this sentence – write it as fast as your hand will move and the pencil will write without setting the paper on fire!
2. The second sentence is the most important sentence of the whole task, the whole writing test, all of IELTS and your entire life! My general overview covers the main trend (for both categories). You can read more about how to write an overview here.
3. The third sentence finishes my overview. Overviews should only be about 2, maximum 3 sentences, long. Do not mention any specific data or give any opinion/speculation.
1. In 1918, household ownership stood at around 23% compared to rentals, which were at nearly 80%. 2. From that point there was a steady rise in ownership and decline in rentals. 3. Rentals reached 69% in 1939 and held steady until 1953 before falling to 59% in 1961. 4. Ownership rose to 31% in 1939, remained there in 1953 before becoming even with rentals at 50% each in 1971.
1. I start with the logical place – the first year. I compare the rentals and ownership in that year. Every single sentence you write should have some sort of comparision. No exceptions!
2. My second sentence summarises the trend that I will continue to detail.
3. My third sentence gives the specific data and years. Always, always include the year and the key data or you could end up with a 5 for task achievement!
4. My fourth sentence continues the comparision of specific data.
1. This trend continued for both percentages with rentals declining sharply to 40% and 31% in 1981 and 1991, respectively. 2. Likewise, ownership rose to 60% and 69% in the same years. 3. In 2001, the falling rate of rentals slackened to 31% (69% for ownership) and there was a small rebound that bucked the trend at the end of period with rented houses rising to nearly 40% and owned houses dipping to just over 60%.
1. My first sentence continues to describe them as ownership overtakes rentals in the middle of the period.
2. The second sentence compares ownership’s data with rentals.
3. My final sentence includes all the data from the graph.
Vocabulary Practice
I put some mistakes into the writing below – can you find and correct the vocabulary mistakes? Some are too informal, others are just incorrect vocabulary…
The described presented diagram illustrates percentages of owned and rented English and Welsh accomodation from 1918 to 2011. Overall, owning and renting showed opposites with a sharper increase in ownership and a reflecting decline in the percentage of renters. By the end of all the period, overall ownership had overcome renting by a big margin.
In 1918, household ownership witnessed at around 23% compared to rentals, which were at near 80%. From that point it was a steady jump in ownership and disaster in rentals. Rentals climbed 69% in 1939 and held straight until 1953 before dying to 59% in 1961. Ownership flew upwards to 31% in 1939, stayed put there in 1953 before equal with rentals at 50% each in 1971.
This trend continued for both percentages with rentals very down to 40% and 31% in 1981 and 1991, respectively. Likewise, ownership rose to 60% and 69% in the same years. In 2001, the ungrowing rate of rentals recovered to 31% (69% for ownership) and there was a upwards that went against at the end of period with rented houses rising to nearly 40% and owned houses going under to way over 60%.
Answers
The presented diagram illustrates percentages of owned and rented English and Welsh accomodation from 1918 to 2011. Overall, owning and renting showed opposite trends with a sharp increase in ownership and a reciprocal decline in the percentage of renters. By the end of the period, overall ownership had overtaken renting by a wide margin.
In 1918, household ownership stood at around 23% compared to rentals, which were at nearly 80%. From that point there was a steady rise in ownership and decline in rentals. Rentals reached 69% in 1939 and held steady until 1953 before falling to 59% in 1961. Ownership rose to 31% in 1939, remained there in 1953 before becoming even with rentals at 50% each in 1971.
This trend continued for both percentages with rentals declining sharply to 40% and 31% in 1981 and 1991, respectively. Likewise, ownership rose to 60% and 69% in the same years. In 2001, the falling rate of rentals slackened to 31% (69% for ownership) and there was a small rebound that bucked the trend at the end of period with rented houses rising to nearly 40% and owned houses dipping to just over 60%.
Vocabulary Definitions
presented: illustrated or shown
opposite trends: reverse movement
sharp increase: increased quickly
reciprocal decline: decreasing in the opposite direction
by the end of the period: at the end of the graph
overtaken: to beat or go in front of or outrank
wide margin: by a lot
stood: were at
nearly: almost
from that point there was: from then on
steady rise: increasing slowly but at the same rate
decline: decrease
reached: were at
held steady: stayed the same
falling: decreasing
rose: increased
remained there: stayed there
becoming even: were level with/equal with
declining sharply: decreasing quickly
falling rate: decreasing trend
slackened: slowed
small rebound: came back up
bucked the trend: reverse the movement/momentum
dipping: decreasing
just over: more than
Grammar Practice
I put some grammar mistakes in it this time – can you find and correct the grammar mistakes? Check your answers with the original answer above.
The presented diagram illustrating illustrates percentages of owned and rented English and Welsh accomodation by 1918 to 2011. Overall, owning and renting had showed opposite trends with the sharp increase in ownership and a reciprocal decline in the percentage of renters. By the end of the period, overall ownership has overtaken renting with a wide margin.
In 1918, household ownership stand at around 23% compared to rentals, who were at nearly 80%. From that point there was a steady rise in ownership and decline in rentals. Rentals reaching 69% in 1939 and held steady until 1953 before falls to 59% in 1961. Ownership rose to 31% in 1939, remained there by 1953 before becoming even with the rentals at 50% each at 1971.
This trend continuing for both percentages with rentals decline sharply to 40% and 31% in 1981 and 1991, respectively. Likewise, ownership rise to 60% and 69% in the same years. In 2001, the falling rate of rentals was slackened to 31% (69% for ownership) and there is a small rebound that bucked the trend at the end of period with rented houses rising to nearly 40% and owned houses has dipping to just over 60%.


0 Comments